
Predicting a league’s table is a common activity amongst fans and pundits. Prior to a season starting, people predict the final table based on perceived lineup strength, off season roster moves, and coaching changes. Throughout the season fans and pundits rarely re-address the full act of predicting the final table with the new information that they have at hand.
In North America, the most common table prediction that you’ll see while a season is in flight is the “Power Ranking”. These are table preditions in all but name, and they do integrate new information about team’s performances, capabilities, and rosters. But power rankings seem to be created by very few people. In the CanPL, for example, there have been two sources of power rankings that I’ve been aware of; the OneSoccer pundits, and Northern Tribune.
Power rankings and pre season table predictions give you point-in-time opinions about the league and its teams. Can you, however, predict the final table (or create your own power ranking) based solely on the current table and the historical table movement of the the league. Specifically, can you do it for the Canadian Premier League?
Data
As always, there are boundaries that need to be drawn around the data that is going to be used. One of the first boundaries is to exclude the 2020 “Island Games” as the format, length, cadence, etc were very different from a “normal” season. These factors make the data unusable for this study.
Another intriguing data bias could be the 2021 season. The influence of starting the season in a “bubble” in Winnipeg could affect the first 8 games that each team played. Additionally, the schedule after the “bubble” was imbalanced with teams within a “region” playing each other more often. I have decided to include the data in the study with these postential biases acknowledged and to be considered when analyzing the data.
The only games considered in any season are the CanPL regular season games. No playoff, Canadian Championship, or CONCACAF games are included. In the case of 2019 where the league ran a split season (Spring and Fall), all games are considered to be part of one season.
There are two main components to consider in the data; the temporal aspects of it and the results. For the purposes of this study, I sliced the data by 3 different temporal checkpoints; after 7 games (25% of the season complete), after 14 games (50% of the season complete), and after 28 games (100% of the season complete). Within those slices of time a team’s results were considered based on the points that those results provided to the league standings where 3 points were assigned for a winning team and 1 point was assigned to each team for a draw.
In the case of the comparison leagues where the teams played more or less than 28 games in their season, reconciliation of this difference and how it is handled for the different analysis will be noted at the point of the analysis. Points assigned for wins/draws/losses were the same as applied to the CanPL games.
In the end, there will be 3 seasons of data in this study. That is a very small sample set. This should be considered when trying to draw any concrete conclusions from the data.
All of the data used is publicly available through any site that shows the league table and game by game results.
Basic tables
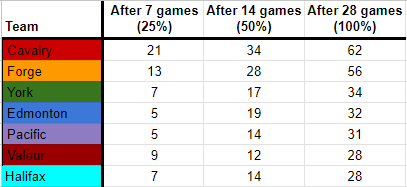
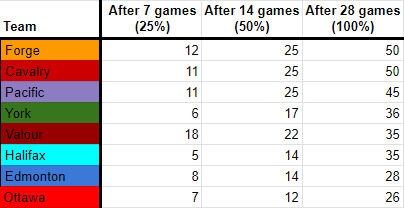
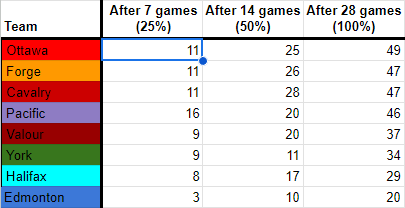
Each CanPL season’s tables, including the slices at 25% and 50%, are shown below as our starting point. The different slices show the points each team had after that number of games. The tables are sorted by the points each team held at the end of the season. Teams tied on points are sorted by wins
2019
2021
2022
Regular season winner
In all three season, the team that had the most points at the end of the season was either in first or second place after 7 games. After 14 games they were either in first or third place.
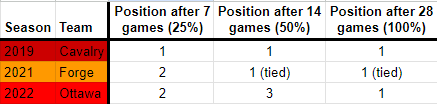
In the case of 2021 Forge, after 7 games the team was 6 points out of first after Valour stormed through the start of the season in the Winnipeg bubble (the first astrix of the article).
In 2022, Ottawa was 5 points out of first after 7 games and 3 points out of first after 14 games in a very tight season-long three way battle for the title.
While the data is limited, there appears to be a pattern here. Teams at or very near the top of the table after 7 games will be at or near the top of the table after 14 and 28 games.
Table movers
Across the league, table movement is not very dramatic after the 7 game mark. Only once in three seasons has a team moved 4 positions in the table between the 7 game mark and the end of the season. That was Valour 2021 who dropped from 1st after 7 games (remember the Winnipeg bubble hot streak) to 5th at the end of the season.
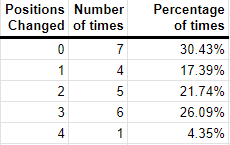
The interesting stat here is that there have been 7 instances of a team finishing the season in exactly the same spot that they were in after 7 games. In 2022, four teams finished in the same position that they held after 7 games; Forge in 2nd, Cavalry in 3rd, Halifax in 7th, and Edmonton in 8th. Half of the table was known after the first 7 games.
Another interesting data point around teams not changing position after 7 games is that there are 5 instances of it happening in the top 3 of the table. In 2019 Cavalry and Forge held first and second, respectively, after 7 games and at the end of the season. In 2022 Forge and Cavalry held second and third, respectively, after 7 games and again at the end of the season. In 2021 Pacific held third after 7 games and again at the end of the season.
In three seasons, there are a total of 9 positions in the “top 3” at the end of the season. Across those three seasons, 5 of those 9 positions (56%) were decided after 7 games. Not only were they decided, their exact position was decided.
If we expand this to look at teams that were in the top 3 after 7 games, and remained there until the end of the season, the number moves up to 6 of 9. After 7 games, 67% of the top 3 teams were decided across the three seasons. The remaining 21 games of each team’s season had no bearing on the top 3 positions in the table for all but 3 teams across 3 years.
Two of the three teams that did manage to move into the top 3 were tied for 3rd after 7 games. So, while in 4th based on wins and/or goal difference, they were actually top 3 teams after 7 games. The other team managed to move into the top 3 came from 5th place at the 7 game mark, only two points out of 3rd.
So why is this happening? Is the points gap between 3rd and the rest of the table after 7 games so high that it is insurmountable? It doesn’t seem that way. The average gap, across all three seasons, from 3rd to 4th after 7 games is less than 1 point. The average gap from 3rd to last after 7 games is 6 points.
That’s a gap where a last place team, on average, only has to win 2 more games than the 3rd place team in the final 21 games of the season. In the worst case, Edmonton in 2022, the Eddies had an 8 point gap to 3rd place after 7 games. They only had to win 3 more games than the 3rd place team in the final games.
Half way through the season (14 games played) the table becomes even more static.
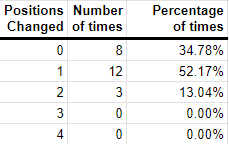
Only three times over three season has a team managed to move 2 positions in the final half of the season. In 2019, Halifax dropped from 5th to 7th and in 2022 Ottawa and Calvalry switched 1st and 3rd positions.
With 20 of 23 positions either not changing or only changing by 1 spot, the table after 14 games has been very predictive of the table at the end of the season. While the league has decided to change its playoff structure every season thus far, this static nature of the last half of the season suggests that regardless of the playoff format, the final 14 games for each team have almost zero impact on the playoff participants.
Using the current, 2023, play off format, five teams make the post season. Looking across all 3 seasons of data, there is only 1 instance where a team outside of the 5 team playoff group after 14 games was able to get into the playoffs. In 2019 Pacific moved up from 6th to 5th. In 2021 and 2022 there was no change to the top five teams in the final half of the season.
Because the league is so small, each team (when the schedule is balanced, which has been rare for a variety of reason) will play each of the other teams in the league 4 times. In much larger leagues (EPL, La Liga, etc) teams only face each other two times per season in league play. The CanPL data set is so small that it is hard to make a conclusive statement, but the data currently suggests that playing each team an additional 2 times (to total 4 times per sesason) doesn’t appear to add any value to establishing the final league table.
Extrapolating the final table
Having observed that there is very little table movement through the CanPL seasons, can we predict the end of season table? One of the simplest approaches to this problem is going to be to multiple the points after 7 games by 4 and the points after 14 games by 2. This isn’t the perfect approach because it assumes a balanced schedule where the first 7 games will see a team play all of the other teams in the league, and a team will play each of the other teams 4 times in the season. This didn’t happen in 2019 or in 2021. Keeping that in mind, this is the approach that will be used.
Using this technique to extrapolate the projected final points from the points totals after 7 games shows that there is a fair amount of variance. Projected points totals can vary from being 37 points higher than the actual points to 15 points lower. The widest variance belongs to the 2021 Valour team that tore up the Winnipeg bubble to start the season (bubble asterix number 3), but couldn’t sustain their winning ways. The second higest variance belongs to the 2019 Cavalry team that started the season with 7 straight wins. And the third highest variance belongs to Pacific in 2022 who were only able to pick up 4 points in games 8 to 14 after tallying 16 in the first 7 games. These are the only instances of over estimating the final points for teams by more 10 or more after the first 7 games.
On the flip side, there are four instance of team’s points totals being extrapolated lower than the final points they received by 10 or more points. The largest variance was Halifax earning 15 points more than the extrapolated value in 2021. The other three instances were either 11 or 12 point differences.
Of the 23 team seasons that are in the dataset, extrapolation after 7 games has had 16 of the team seasons be accurate to the final table points by +/- 8 points. Nine of those, 39% of all team seasons, have been accurate by +/- 3 points, a single win in the season.
If the final points are extrapolate after 14 games have been played, the variance between extrapolated values and final points gets narrower. There is only one instance of the extrapolation being +/- more than 10 points; York in 2022 over performed the extrapolated value by 12 points. The second largest variance is +/- 9 points which has occurred two times, both where teams have underperformed the extrapolated values.
Of the 23 extrapolations, 12 of them have been been accurate by +/- 3 points. All but four of the extrapolations have been accurate within +/- 6 points of the final table. There are also 7 instances (30%) where the extrapolation has been accurate. This suggests that teams are not earning points in the final 14 games of the season at any significantly different pace than they do in the first 14 games.
Like the changes in table positions data, this data suggests that the final 14 games of the season do not have any impact on figuring out which club is stronger. That has already been determined in the first 14 games.
Forge’s slow starts
One of the common stories told, by fans and pundits alike, is that Forge is notorious for starting the season slowly, building momentum after a handful of games, and driving that momentum to the top portion of the league table by season’s end. Is that the case though?
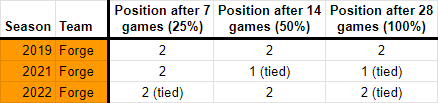
Looking at where Forge sat in the table at each time slice shows that they don’t really drive up the standings at all. Only in 2021 did they move up as the season went on.
Looking solely at the position in the table might not tell the whole story. It’s possible that Forge has gotten better as the season progressed, but just not enough to move up to that seemingly elusive top spot in the table. Using points per game it’s possible to see if Forge’s performance increased while not being reflected in the table.
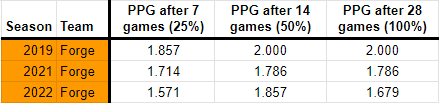
Points per game (PPG) shows that Forge did, in fact, increase their output after the first 7 games in 2019 and not move up the table. They also increased their out put after 7 games in 2021 but did manage to move up in the table. 2022 was a bit of a roller coaster that saw an increase in production after 7 games followed by a decrease in the final half of the season.
In 2019 the output increase was 0.143 ppg and Forge was only able to cut the gap to first place (Cavalry) by 2 points between the 7th game and the end of the season. Cavalry were very good through out the season and their 7 game unbeaten start to the season was too much for anyone to challenge.
In 2021 Forge increased output by 0.072 but moved the gap from being 6 points behind first place Valour to being 15 points ahead of Valour at the end of the season. Coming out of the Winnipeg bubble (asterix number 2 of the article) all the top teams were able to increase their points production with the exception of Valour who couldn’t maintain the pace they set in the comfort of IG Field.
Compared to the other CanPL teams, Forge is consistent while in the top half of the table. Many other top of the table teams, especially those that are very strong in the first 7 games, are unable to sustain the pace they initially set. Forge, on the other hand, hardly wavers as the seasons progress.
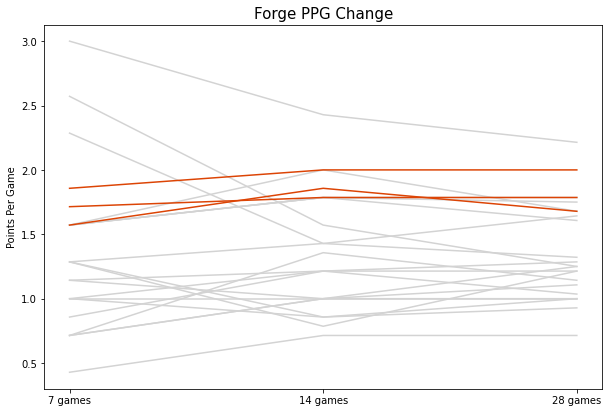
While the legend of a slow start for Forge makes for good story telling, the data doesn’t support the story. Forge performs very similarly before and after the first 25% of the season is completed. As the season progresses, they retain their table position and produce similar points per game.
2023
Now that we’ve established our historical data, and the trends/patterns that might exist within it, what does the 2023 CanPL table look like if we apply that information to the table at the quarter finished point (after 7 games)?
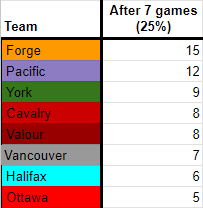
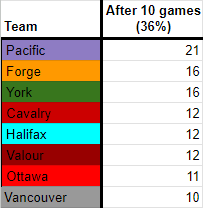
First, we can look at the number of table positions that a team might move. Using the historical data we know that there have been 6 instances, of 9 possible opportunities, (66.7%) that a top 3 team at the 7 game mark will be in the top 3 at the end of the season. Applied to CanPL 2023, two of Forge, Pacific and York will be in the top 3 at the end of the season. As the 2023 season has progressed the table is less clear because it starts adding midweek games in an imbalanced way. Looking at the standings after all teams have played 10 games, a clear separation of the top 3 teams has appeared in the table, and all of those teams were in the top three at the 7 game point.
It’s not as clear that there’s a pattern for the bottom 3 teams in the table after 7 games played in the season. Like 2019 and 2020, there is a very small points spread between the bottom 3 teams, but they’ve not been clearly separated from the rest of the table. This is an important group in 2023 since those three teams will be the only ones missing the CanPL playoffs. You can, however, make predictions with more confidence at the 14 game point. If a team is outside the playoff five after 14 games, they historically have had a 12.5% chance of moving up into a playoff position. And, given more context, that chance only exists for a team in 6th place at that time.
Much has been said about the large number of drawn games in CanPL 2023, and that is probably fodder for an entire article on its own. That said, the points per game that a team is able to establish after 7 games played is pretty accurate to their end of season total. Teams will acheive their predicted total points +/-8 points, or +/-0.286 points per game, 69.5% of the time. With the inordinate amount of drawn games to start 2023, it is possible that there could be more teams doing better than this since getting more than one win out of every three games will be a points improvement for many of the draw-heavy teams.
In the broader context
As has been noted in multiple places in this article, there is a very small sample size for CanPL games. Small enough that its necessary to include some fairly large caveats into the discussion; the 2021 Winnipeg bubble and unbalanced schedules being two very large ones.
It’s important to look at other leagues to see how they compare to the CanPL. There’s a lot to do to make an equitable comparison across leagues though. Because of that it’s best that it doesn’t get included in this write up, instead getting an article of its own where constraints, considerations and data impact can be outlined in addition to the patterns that may, or may not, appear.